
In forex trading, range boundaries refer to the upper and lower limits of a price range where a currency pair’s price fluctuates without breaking out significantly. These boundaries are typically defined by support and resistance levels:
Identifying range boundaries early
Alright, you should take the following action following a significant impulsive move and after the price makes a pertinent swing high and swing low inside the current price action zone.
You should always anticipate that a trading range is soon to form and begin searching for its borders using support and resistance levels in order to identify the range early. This is a crucial component of the range trading approach.
By definition, a range has formed when you can draw two horizontal lines on the chart, each of which connects at least two different points in the market, according to the majority of traders and range trading books. I will give you an example.
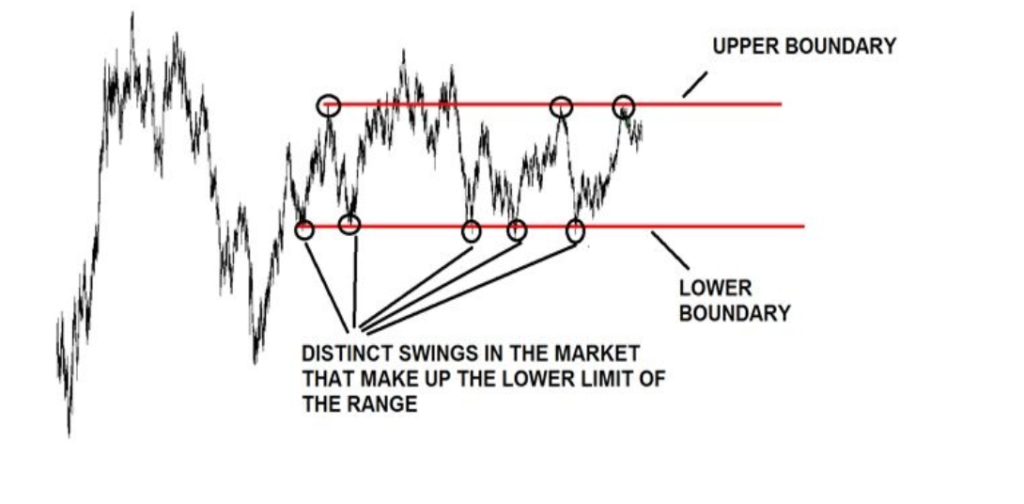
The fact that this trading range contains three distinct points for the top limit and five distinct points for the lower limit already makes it extremely well defined.
This range is extremely mature, and since it has held for a long time, it is likely to be broken soon. You must be able to recognize a range before it ever forms in order to earn from trading it.
Theoretically, there is nothing incorrect with the definition that states that the lower limit must consist of at least two distinct points, and the upper limit must consist of two distinct points.
Discover Giant Hunter AI

However, you will frequently discover that waiting for two separate swings on each side is not a very smart concept when you put it into reality.
Often, the range will have passed by then, and you will be trading it just before it breaks. I personally take a different tack when it comes to defining the range’s limits. I have repeatedly tried and traded this, with great success each time.
You should just wait for two points on one side rather than two points on each side. The second distinct swing on the opposite side will then be found by using price action readings, support, and resistance. I will start with an example.

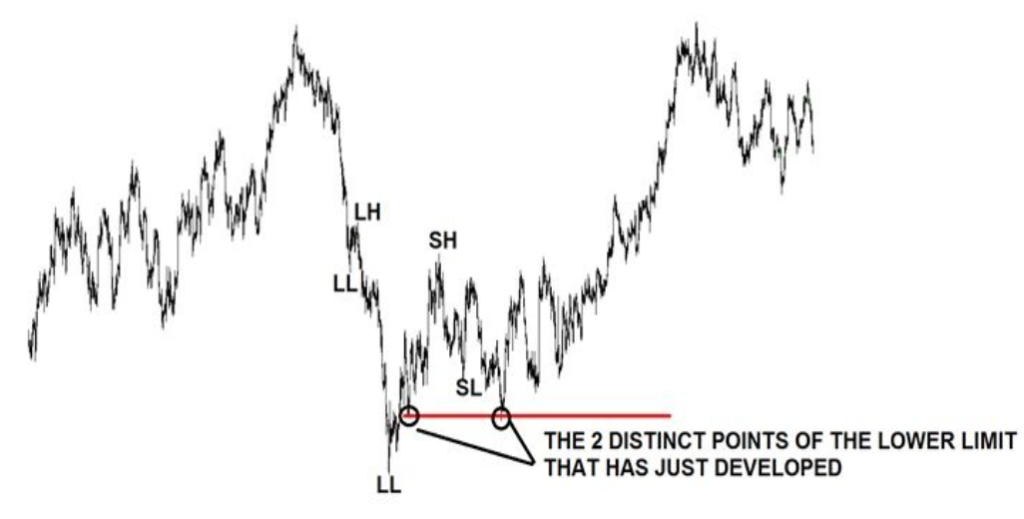
This chart shows a downward trend. A significant impulsive move downward following the trend’s second lower high suggests that the downtrend may be coming to an end and a trading range may form. Since we are now unsure, we must wait for confirmation in the shape of a pertinent swing high-swing low combination within the recent price action’s zone.
As the price begins a corrections move against the trend and rises and falls to create the swing high, this did in fact occur later. It then rises once more, forming the swing low and the second point for the trading range’s upper limit simultaneously. The highest limit of the range is now composed of two separate points. Next, we use price action to try and determine the lower limit.
They are probably responsible for the range’s bottom limit. Only two pertinent support zones are indicated by the little red rectangles in the illustration above. The swing low itself is the first, and the trend’s final lower low is the second.
You wait for the market to move to these stretched, parallel lines with the range’s upper limit so you can read the price action indicators that will indicate the lower limit. Analyzing the candlesticks, searching for diagonal support and resistance zones, and looking for reversal price patterns in these support zones are all part of this price action reading.
This will be covered in more detail later in the blog. To help you better grasp how to identify the swing high, swing low, and the initial range boundary that appears on the chart, allow me to offer you another example for the time being.

In this case, we do not yet have a range boundary after the price provides us with the swing high and low. At the support and resistance levels pertinent to the most recent price movement, we begin drawing long horizontal lines.
Since the swing low itself serves as the first visible support, we draw an extended horizontal line at that point. That tiny swing low, which we do not specifically take into account because to its size, represents a lesser support zone further down. I am referring to the price’s tiny support at the large black circle.
Here, too, we draw a line. We then descend even further and create a similar line at the large support provided by the downtrend’s final lower limit.
In order to determine the bottom limit of the trading range, we now watch for the price to decline, respond to one of our lines, and reverse. The price stops and reverses at the second red line, as you can see. The bottom limit is this. Naturally, as no border has existed yet, you are not need to draw these lines at this time.
I merely wanted to show you how well you can use basic support and resistance to anticipate the range boundaries. We draw lines to approximate its most likely location at the second limit. I will show you this chart once more, this time with the first barrier established.
Thus, the bottom limit of the trading range has appeared in this scenario. Now, by drawing lines at resistance spots, you will attempt to predict the upper limit.

The price rises, crosses the initial resistance, and then falls again, confirming that line as the trading range’s upper limit.
The price then rises once more before touching the second red line and falling once again. This indicates that the second line is an upper limit and validates it as well. As a result, your trading range now has two upper bounds. Let us take another look at the same chart.
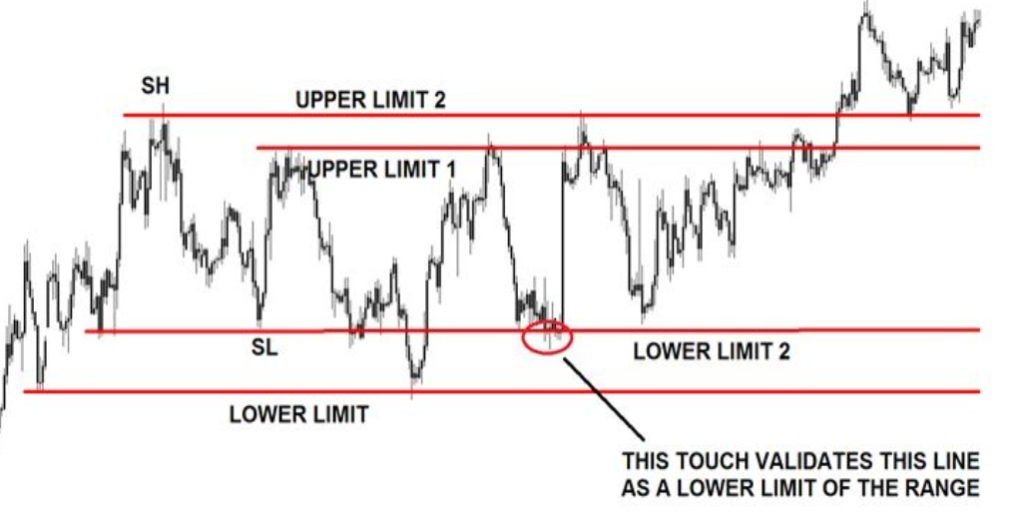
You can observe that following the first upper limit, the price declines, but only to the first support line, which then proves that it is also a lower limit by touching it again before reversing.
Thus, there are two boundaries on either side of this trading range. Let us look at another example of determining a trading range’s second boundary.

The price makes a powerful, impulsive advance without any corrections in this chart, indicating an upward trend and the likelihood of sideways movement. After hitting its peak, the price swings low and high.
The swing high is lower than the trend’s highest point, while the swing low is higher than the trend’s most recent higher low. This is ideal. Now all you need to do is watch for the range’s initial border to form.
As previously shown, the first boundary typically forms around the preexisting support and resistance levels, followed by the second boundary.
Discover Giant Hunter AI
The price in the aforementioned case approaches the swing low, which is a support region. That region becomes the lower limit of the range when it briefly remains there before reversing.
Observe that the price moves just above the swing low level before reversing in its attempt to reach this lower boundary.
This is completely OK because it is uncommon to see the price stop precisely at the right level. Almost invariably, it will either slightly exceed it or fall short of it.
For this reason, it is crucial to ensure that the long horizontal lines that define the trading range’s borders on your chart connect to the market’s swings or other identifiable points. To connect the swing low with the second swing in the red rectangle that the price just made, the line in the example above should be drawn precisely as it is.
You should never alter or modify these lines once you have drawn them. As you can see, the red line was supported by subsequent price action, which responded to it a few times.
Now, let us look at the area where the upper limit is most likely to appear.
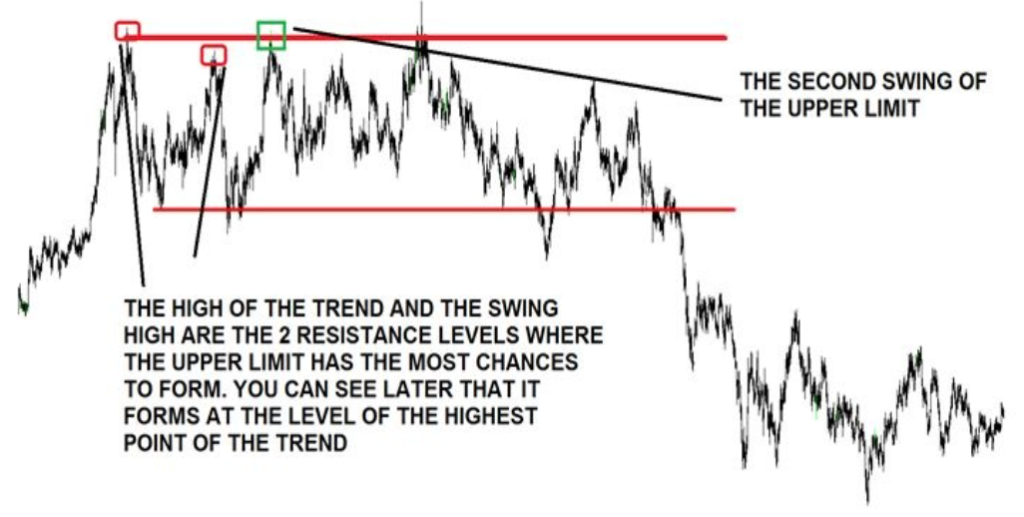
The above chart essentially speaks for itself. At the uptrend’s maximum high, the upper limit begins to take shape.
You should draw that higher red line beforehand, expecting the price to reverse there and reach the upper limit. At the swing high level, the second location where the upper limit is most likely to emerge, another line should be drawn.
The lower and higher bounds of the trading range are the only lines remaining on the chart after you remove the line formed at the swing high when you see that the upper boundary forms at the highest high.

Instead of waiting for the range to fully form, you should use price action to choose an appropriate level to sell this pair after the second point of the upper limit forms exactly at the horizontal line you have previously drawn.
By definition, the range would only be fully created when the price touched the upper boundary a second time before reversing course and falling to validate that level. This will keep you out of the market during the first stage of the trading range, when range trading is most lucrative, and it is frequently too late.
Discover Giant Hunter AI
