Trade Entry in Forex refers to the process of initiating a buy or sell position in the foreign exchange market. It is a crucial step in trading, as it determines the starting point of a trade. A well-timed and planned entry can significantly impact the trade’s profitability.
It is time to read the price movement to make sure the second boundary will form at one of your previously drawn extended lines, then enter the market and trade the range to profit when you perceive that the price is about to establish the second boundary of the trading range.
You accomplish this by carefully examining the signals that candlesticks provide, searching for reversal price patterns that indicate the price will shift course and move to the opposite range border, and closely monitoring diagonal support and resistance zones.
Candlesticks
The shape of the candlesticks, the environment in which they form, and—above all—the timing should all be considered when attempting to read them for signals about what the price is likely to do next.
By looking at your chart’s candles, I will show you how to enter a range trade as soon as the price begins to indicate that the range’s second border is taking shape.

Here, we have the following circumstances: A range is most likely to form when there is an overall downward trend and the price makes swing highs and lows inside the recent price action zone.
Furthermore, the price drops to the trend’s lowest point and then rises again, creating the trading range’s lower limit. When you see this price behavior, you draw long lines at the resistance areas where there is the greatest likelihood that the range’s upper border will form.
Observe how the price easily moves north after rising back up from the lower limit. The move is almost entirely composed of green candles, with two of them accounting for a significant portion of the total movement.
Given that this is a 4-hour chart, the price has risen practically straight up with not even a slight correction move, indicating that the buyers have driven the price higher in just eight hours with tremendous force and no opposition from the sellers.
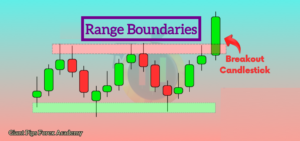
However, the price stalls and begins to move sideways when it hits the upper red line that you had already drawn, expecting this to be the area where the upper limit will form.
This pair starts to move up and down in a very narrow price range, producing little candles with small bodies and, more importantly, huge upper wicks, rather than the robust bullish candles with enormous bodies that it used to make.
The first indication should be that the price has changed from a powerful upward movement with large green candles to a sideways movement with small green and red candles, all of which have large upper wicks.
Discover Giant Hunter AI

This is all taking place precisely at the red line you previously drawn. The purchasers have total control because of the powerful rally that produced those gigantic green candles without upper wicks and with large bodies. A large wick indicates that a price level has been rejected.
The sellers were not there at the time, as indicated by the large green candles’ lack of any significant upper wicks. The candles go from large, green, and without upper wicks to tiny, with enormous upper wicks and minuscule bodies, as the price gets closer to the red line.
The large upper wicks at the red line indicate that the level has been rejected; in other words, the sellers have now begun to show that they believe this level is a favorable selling opportunity for this pair. Those sideways candles’ tiny bodies indicate either equilibrium or hesitation.
To sum up, the tiny sideways candles with large upper wicks that appear exactly at the red line provide a clear indication that the buyers of this pair are losing control and that the seller has finally joined the market and is engaged in combat with the buyers.
As you can see from the blue square on the accompanying chart, this conflict between the buyers and sellers creates a relatively narrow range there.
You should generally wait for a big body candle without a wick that is going strong in one direction, followed shortly after by a group of sideways candles that are smaller than the previous one and have large wicks.
This will indicate that the other side has won the war and the price direction will reverse, creating the second point of your boundary, completing the trading range, and allowing you to begin trading that range and making some nice profits.

Here’s another instance where you can predict what will happen next by reading the candles. Large red candles with large bodies are visible when the price drops quickly and with great velocity. Price movement shifts and it begins to form little candles with lower wicks as it reaches the price level where you anticipate the trading range’s bottom limit to be.
The first is what you would call a hammer, which is a long candle with a very large lower wick and a very little body placed close to the top of the flame. This indicates that buyers have begun to enter the market and are currently posing a threat to sellers at this level.
Following that price, more tiny candles with bodies that are the same size as the candle bodies and wicks that match them are displayed.
This confirms your idea that the price will probably turn around from here and set this level as the lower bound of the trading range. However, you require additional verification that this is, in fact, taking place. Following the four to five sideways little candles with lesser wicks, that confirmation appears shortly after in the form of that large body, no wick green candle.
Discover Giant Hunter AI
As you can see in this example, the price drops a few points past the red line that was placed on the chart beforehand, rather than stopping precisely there.
As long as the price reverses and you get a confirmation candle that the price will go in the opposite direction from here, this is totally acceptable. Seldom will you find the price halting and reversing just where you anticipate it to.
It will frequently surpass your level by a minimal number of pip points or fall short of it. It is crucial that you view these swing highs and lows, or support and resistance levels, as areas of the market’s price rather than precise locations.
You should not necessarily expect the price to hit your level precisely; if it reacts somewhere near it and there are obvious indications that it will reverse, that is good enough.
Discover Giant Hunter AI